Using Simulation-Based Stress-Testing to Build Truly Robust Driver Monitoring Systems
Table of Contents
Table of Contents
Why GSR Certification Isn't Enough for DMS Validation
It is 06:47 on a January morning. A driver on the A9 motorway approaches a tunnel exit after forty minutes of highway monotony. Inside the cabin, the DMS is running its DDAW pipeline on a near-infrared camera mounted on the steering column. As the vehicle crosses the threshold from tunnel darkness into low-angle winter sunlight at roughly 15° elevation, the NIR illuminator (calibrated for controlled ambient conditions) is momentarily overwhelmed. For 1.2 seconds, the per-frame gaze classifier receives a saturated, feature-poor image and outputs a confident “eyes open” prediction. The driver is in the early stages of a microsleep. The DDAW system does not trigger.
The vehicle passed GSR certification. Every required test was completed successfully.
This illustrative tunnel example is not a software defect in the conventional sense. It is a distribution failure: the system performed exactly as its training and certification process prepared it to perform and no further. GSR’s operational envelope did not include this lighting transition. The stress-test suite never generated it.
Regulatory compliance defines what a system must detect. It says nothing about where it will break. Closing that gap is an engineering problem, and systematic simulation-based stress-testing is its most tractable solution.
Hint: The tunnel exit on the A9 is a photometric failure. One category in a six-part failure surface that the following sections will map systematically.
The DMS Stress-Testing Taxonomy: Six Failure Modes to Validate in In-Cabin Monitoring
A driver monitoring system operates at the intersection of computer vision, sensor physics, and human behavioral variability. Each of those dimensions introduces its own failure surface. Understanding that failure surface systematically before deployment is the foundation of any credible stress-test strategy.
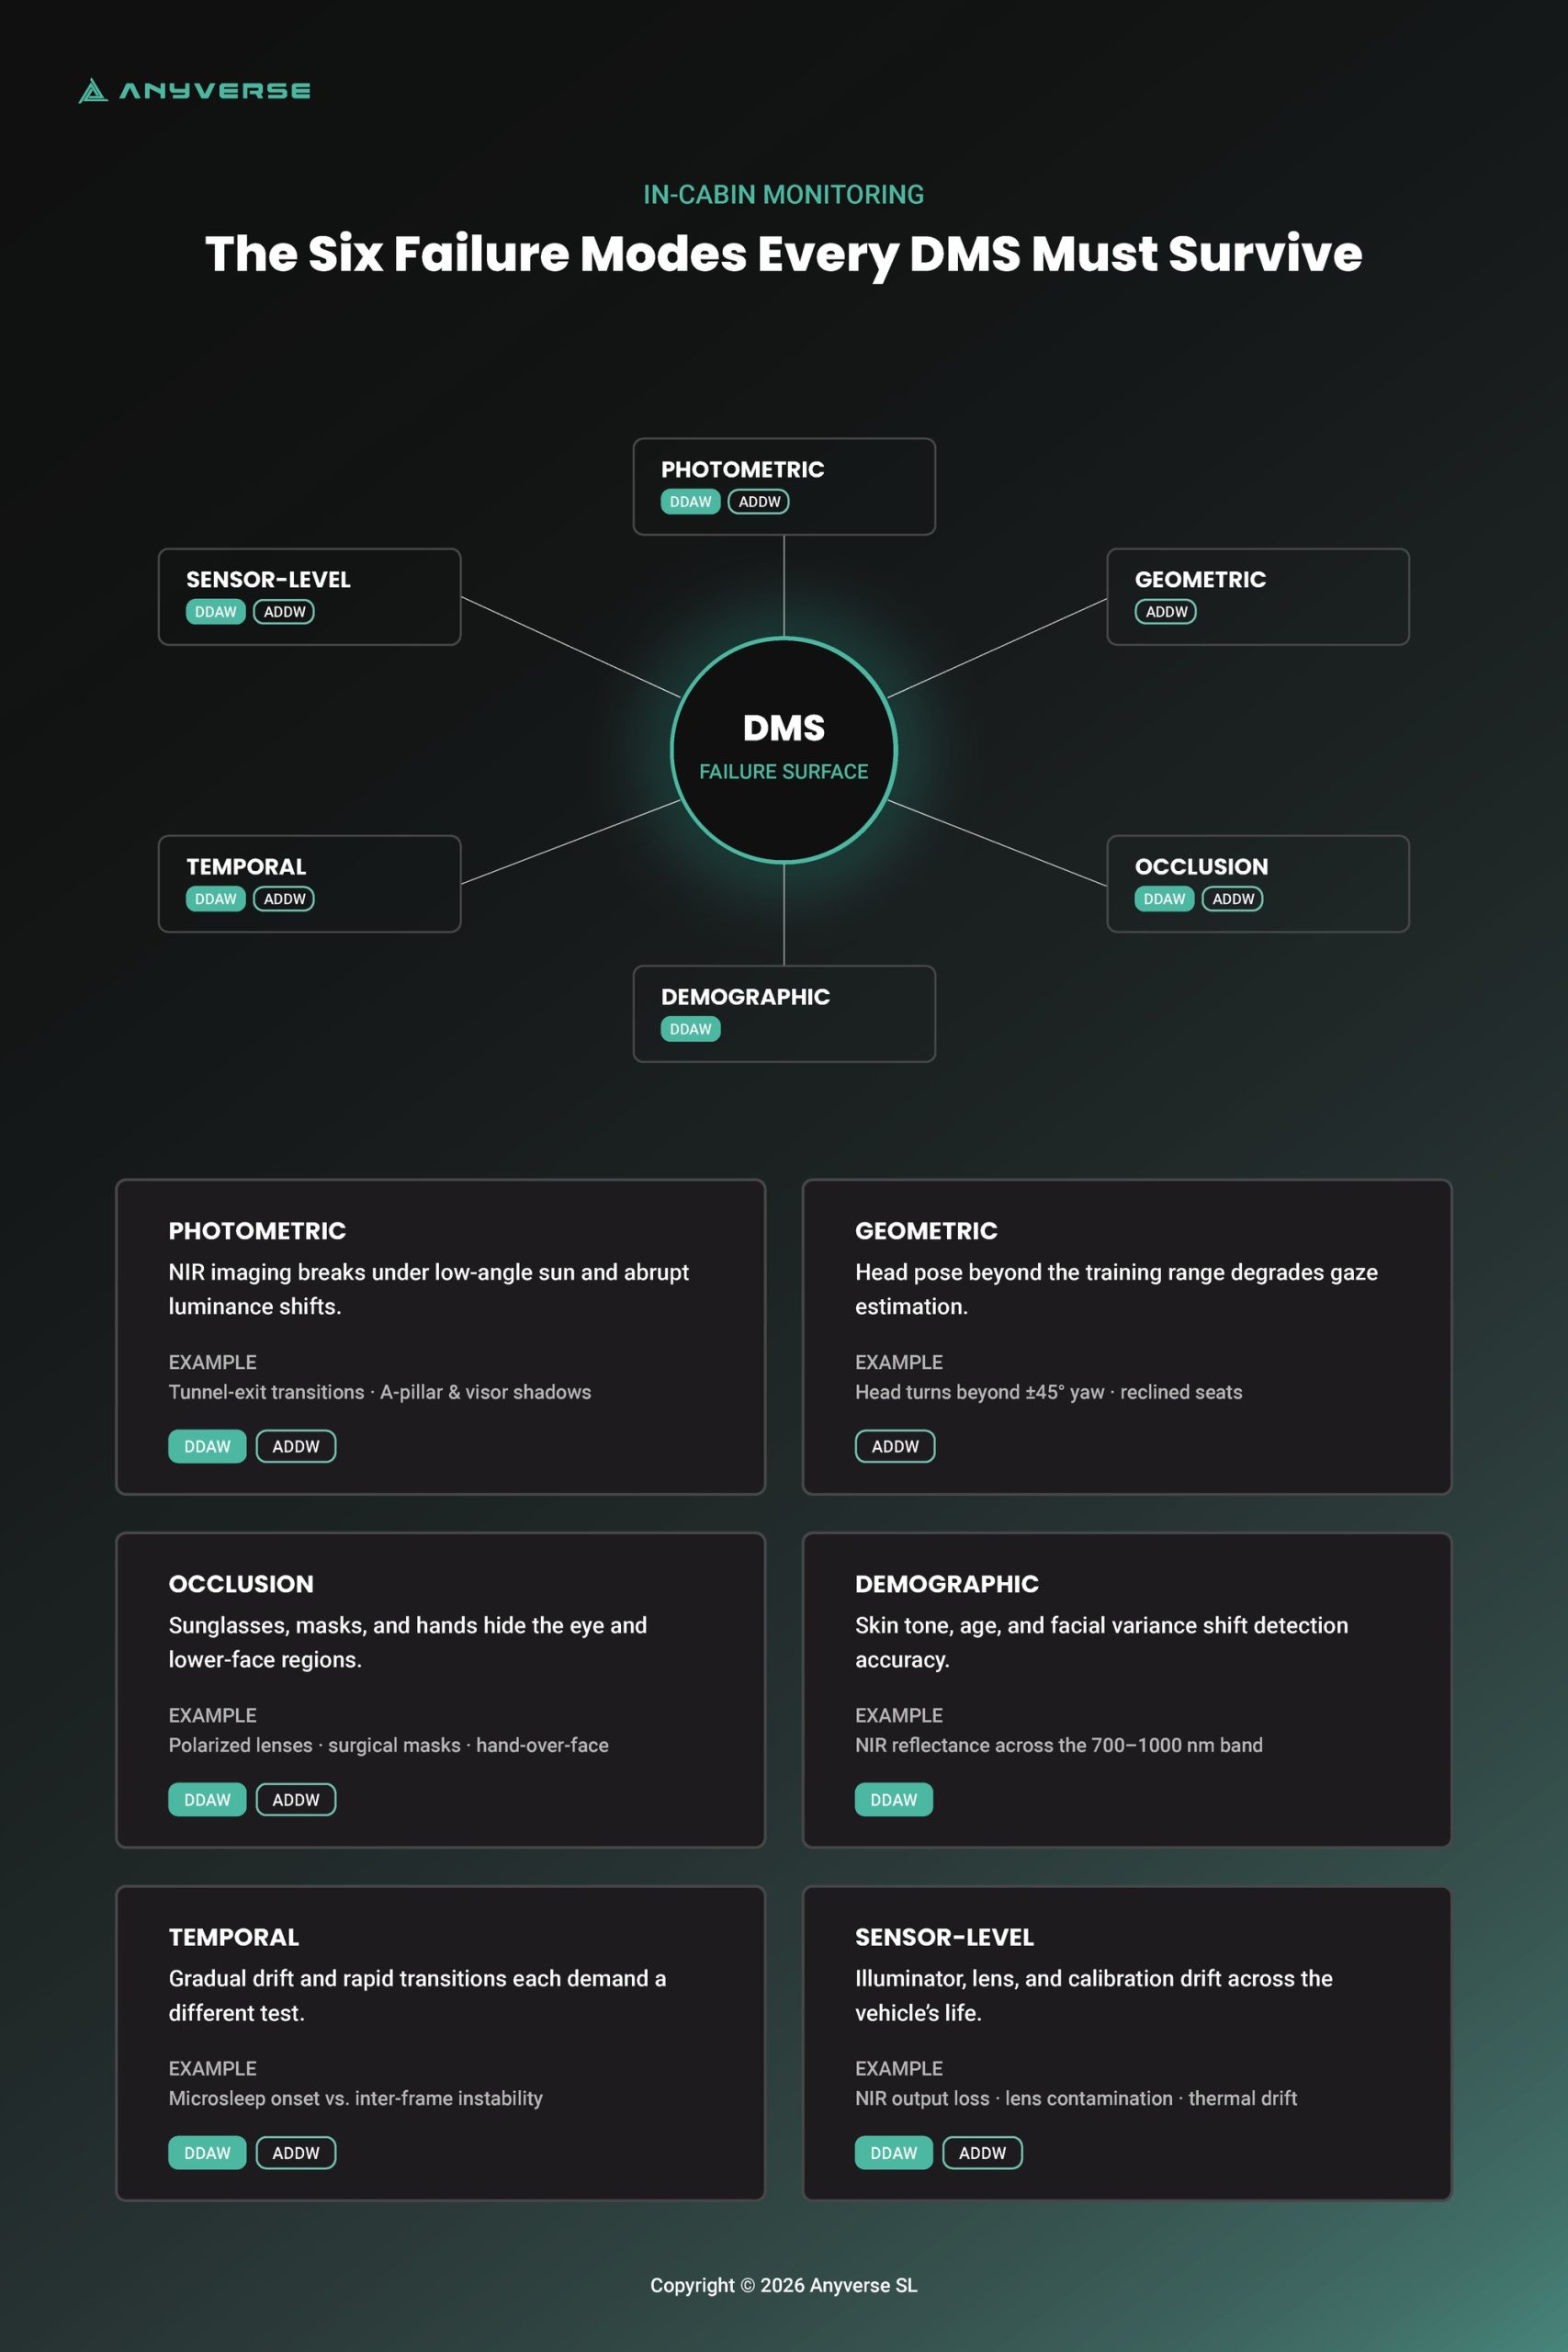
The following taxonomy organizes DMS failure modes into six categories. Each is present in production environments. None is adequately covered by GSR certification testing alone.
Photometric Failures
Primary risk: DDAW (PERCLOS degradation) and ADDW (gaze vector instability)
Condition | Failure Mechanism |
Low-angle sunlight (10–20° elevation) | NIR illuminator overwhelmed; facial landmark detection unreliable |
Tunnel exit transitions | Abrupt luminance shifts cause per-frame classifier breakdown |
A-pillar / sun visor shadows | Lighting-dependent partial occlusion; absent from static test sets |
Geometric Failures
Primary risk: ADDW (gaze vector error growth at large head pose angles)
Condition | Failure Mechanism |
Short drivers / elevated seat position | Head pose distribution outside training range |
Tall drivers / reclined seats | Extreme pitch angles degrade landmark detection |
Head turns beyond ±45° yaw | Pose estimation error grows, and facial landmarks become partially self-occluded at large yaw; gaze vector error increases accordingly |
For ADDW specifically, gaze vector estimation is sensitive to head pose: estimation error rises as yaw increases, and accuracy degrades at large angles where facial landmarks become partially self-occluded. Boundary conditions beyond roughly ±45° yaw are where this degradation is most pronounced and least covered by nominal testing. For DDAW, geometric variation affects PERCLOS estimation accuracy when eyelid landmark tracking is degraded by off-angle camera geometry.
Occlusion Failures
Primary risk: DDAW (eye region loss) and ADDW (head pose estimation degradation)
Condition | Failure Mechanism |
Polarized / tinted sunglasses | NIR transmission attenuated; eye region features undetectable |
Fabric / surgical masks | Lower face occluded; landmark-based fatigue indicators disrupted |
Hands over face | Transient full occlusion; inter-frame consistency breakdown |
Demographic Failures
Primary risk: DDAW (potential systematic false negatives in drowsiness detection across underrepresented groups)
Condition | Failure Mechanism |
Skin tone variation | NIR reflectance varies with skin pigmentation across the 700–1000 nm band DMS illuminators rely on; higher melanin absorption can lower signal-to-noise ratio, so eye-state and landmark detection must be validated across the full range of skin tones rather than assumed uniform. |
Periorbital tissue laxity (older drivers) | Age-related periorbital changes — eyelid laxity and altered aperture — can bias PERCLOS estimation toward false negatives, making older drivers a demographic dimension that warrants explicit coverage. |
Facial geometry variance | Model performance degrades outside training demographic distribution |
Temporal Failures
Two distinct phenomena — different failure profiles, different testing methodologies
Type | Detection Task | Failure Mechanism | Testing Approach |
Gradual-drift | DDAW | Microsleep onset accumulates below detection threshold | Synthetic temporal sequences simulating realistic onset trajectories |
Rapid-transition | DDAW + ADDW | Abrupt environmental changes cause inter-frame classifier instability | Frame-level transition testing at boundary conditions |
These two phenomena should not be conflated. Gradual-drift detection requires temporal window analysis and sensitivity to sub-threshold accumulation. Rapid-transition detection requires frame-level stability testing at environmental boundaries. A test suite that addresses one does not address the other.
Sensor-Level Failures
Primary risk: systematic performance degradation across both DDAW and ADDW
Condition | Failure Mechanism |
NIR illuminator degradation | Output loss over vehicle lifetime; gradual image quality decline |
Lens contamination | Dust, condensation, manufacturing residue reduce sharpness progressively |
Multi-camera calibration drift | Thermal cycling causes geometric misalignment over time |
These six categories are not independent. A low-angle sun combined with polarized sunglasses and a head pose at the edge of the training distribution is not a contrived worst-case scenario — it is a Tuesday morning commute. The failure modes compound, and a stress-test strategy that treats them in isolation will miss the combinations that matter most in production. Next, we will address how to design a test suite that accounts for that interaction systematically.

Stress-Test Scenario Design: Methodology and Evaluation Metrics for Driver Monitoring Systems
Identifying failure modes is necessary but not sufficient. The engineering challenge is translating a failure mode taxonomy into a test suite that is systematic, tractable, and produces a meaningful performance signal.
Each failure mode category previously described maps to one or more controllable parameters. Photometric failures map to illumination angle, intensity, and spectral composition. Geometric failures map to head pose angles, seat position offsets, and camera mounting geometry. Occlusion failures map to occluder type, coverage area, and transmittance. A stress-test suite is constructed by defining the parameter ranges for each category and systematically sampling across them.
The practical approach is a structured parameter sweep: for each failure mode dimension, define a baseline value, a degraded range, and a boundary condition. Test performance at baseline, at incremental steps through the degraded range, and at the boundary. The result is a performance degradation curve, or how the system performance declines as the parameter moves away from nominal, rather than a binary pass/fail verdict. Degradation curves show not just whether a system fails, but where and how steeply.
Managing the Combinatorial Explosion
A six-category failure mode taxonomy with multiple parameters per category generates a combinatorial space that cannot be exhaustively tested. Three practical strategies manage this:
Strategy | Description |
Risk-prioritized coverage | Test combinations most likely to co-occur in production first. Low-angle sun + polarized sunglasses + extreme head yaw is a realistic morning commute scenario. Full-factorial combinations of unlikely co-occurring parameters can be deprioritized. |
Boundary-condition focus | Concentrate test effort at parameter edges rather than sampling uniformly across ranges. System failures cluster at boundaries; dense sampling in the nominal range adds marginal signal. |
Automated parameter sweeps | Scripted scenario generation handles the volume that manual test case authoring cannot. Define the parameter space once; generate variants programmatically. This is only tractable with synthetic data pipelines. |
Differentiating DDAW and ADDW Evaluation Metrics
Conflating DDAW and ADDW evaluation is a persistent source of imprecision in DMS validation. They require distinct metric spaces.
For DDAW:
- False negative rate on drowsiness events at defined PERCLOS thresholds
- Blink detection latency and eyelid landmark stability under photometric stress
- PERCLOS estimation error as a function of lighting condition and occlusion state
- Temporal sensitivity — minimum microsleep onset duration detectable at specified confidence
For ADDW:
- Gaze vector estimation error as a function of head pose angle
- Distraction event detection latency at boundary head pose conditions
- Head pose estimation error under occlusion and demographic variation
- False positive rate under rapid head movement
In both cases, metrics should be computed not only at the aggregate level but disaggregated by subgroup — lighting condition, demographic category, sensor state, and occlusion type. Per-subgroup disaggregated metrics represent emerging best practice in rigorous SOTIF-aligned documentation. ISO 21448 requires demonstrating safe operation across the full intended operational domain, which encompasses demographic subgroups and adverse environmental conditions, making subgroup performance analysis a well-grounded engineering expectation, though neither ISO 26262 nor ISO 21448 currently mandates it as an explicit documentation checklist item.
Defining Pass/Fail Criteria
Binary pass/fail thresholds have limited utility in stress-test contexts. A more productive framing is the performance envelope: the bounded region of the parameter space within which the system meets its detection requirements. Defining the envelope explicitly and verifying that it encompasses the full distribution of expected production conditions is a more rigorous and more auditable validation outcome than a single compliance threshold.

Why Real-World Data Cannot Close the Validation Gap for DMS
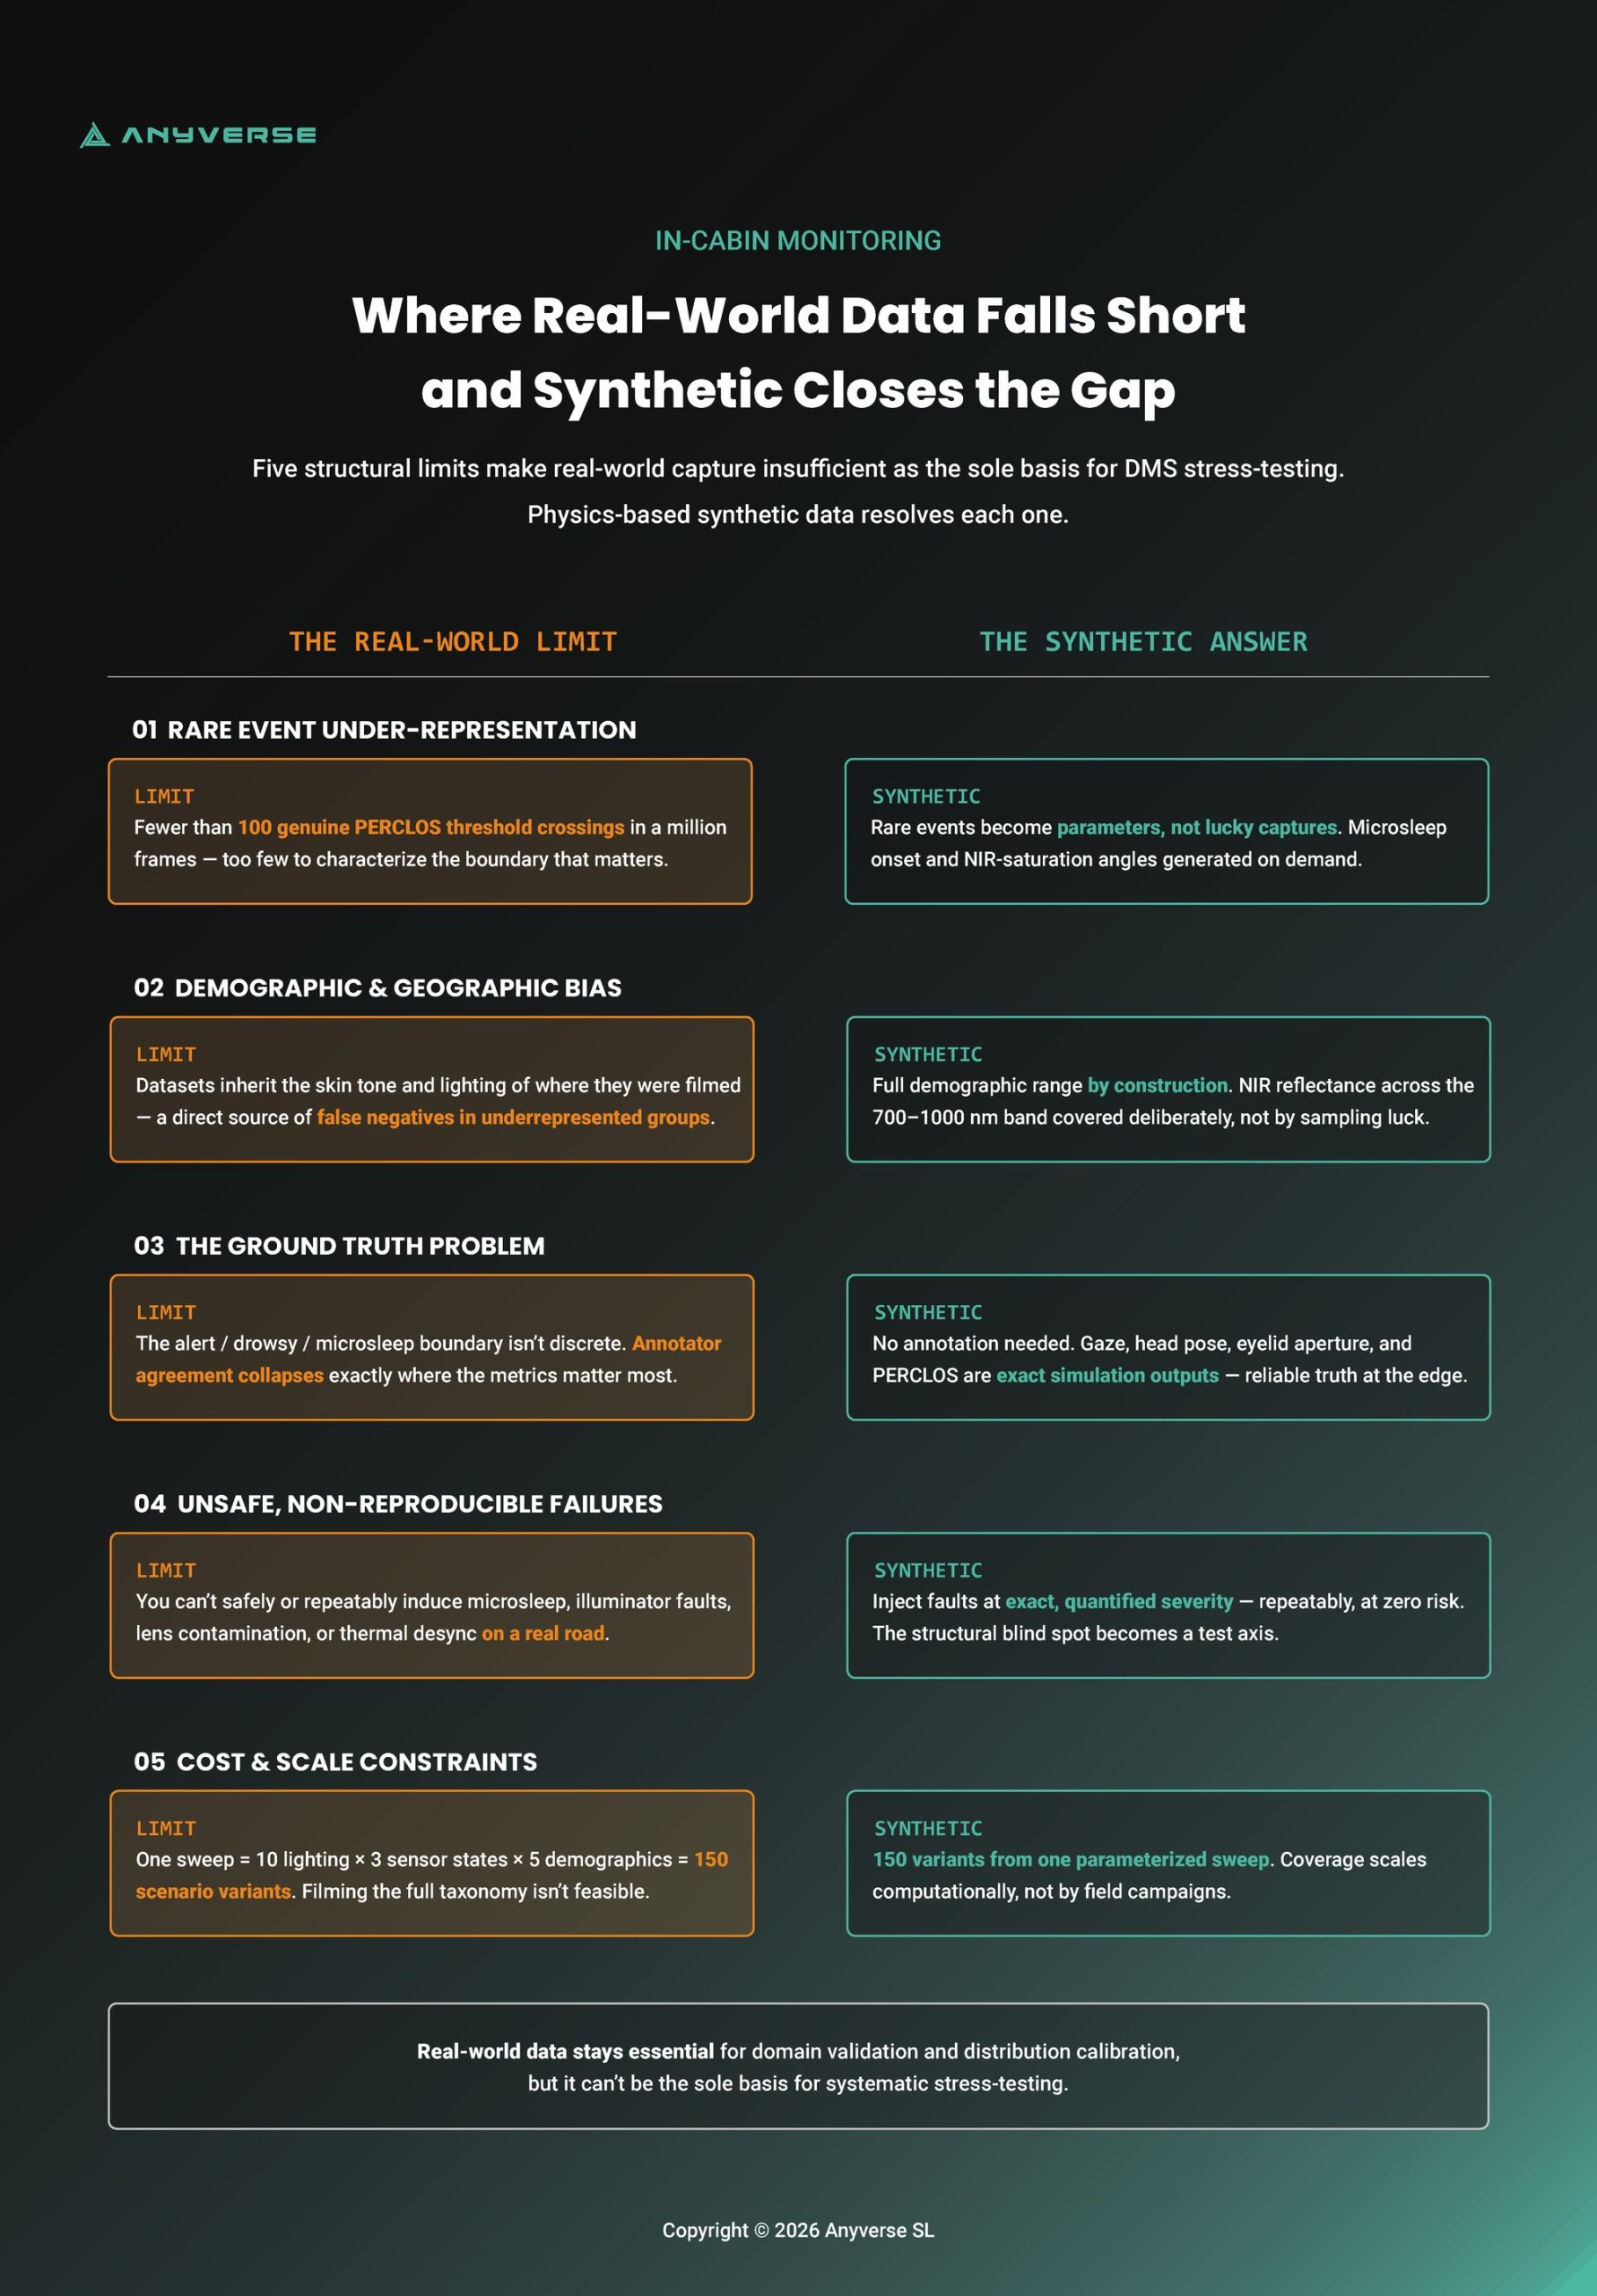
A stress-test suite is only as good as the data that populates it. For driver monitoring validation, real-world-collected data has five structural limitations that collectively render it insufficient as the sole basis for stress testing.
Rare Event Under-Representation
The conditions that matter most for DMS stress-testing are, by definition, uncommon:
- Microsleep onset events are statistically scarce in naturalistic driving datasets
- NIR illuminator saturation at specific sun angles requires precise environmental conditions that may appear only a handful of times across millions of collected frames
- Extreme head pose excursions occur infrequently enough that boundary-condition coverage is structurally inadequate
A dataset of one million frames may contain fewer than a hundred genuine PERCLOS threshold crossings under adverse lighting, insufficient to characterize system performance at that boundary with any statistical confidence.
Demographic and Geographic Collection Bias
Real-world datasets reflect the populations and geographies where data collection campaigns were conducted. For DMS validation, this creates systematic gaps:
- Skin tone distributions are skewed toward collection geographies
- Facial geometry variance outside the training demographic degrades landmark detection confidence
- Lighting condition profiles in the dataset may not match deployment markets
For DDAW systems where NIR reflectance varies across skin tones, this is not a fairness concern in the abstract — it is a direct source of systematic false negatives in underrepresented populations.
The Ground Truth Problem
The most technically acute limitation for DMS validation specifically
Human annotators labeling drowsiness states on video frames face an inherently ambiguous task:
- The boundary between “alert,” “drowsy,” and “microsleep onset” is not visually discrete
- Inter-annotator agreement on ambiguous frames is notoriously low
- Evaluation metrics computed against inconsistent labels become unreliable at precisely the conditions under stress
For DDAW, PERCLOS threshold crossings — the most critical evaluation point — are also the frames where ground truth is least reliable. For ADDW, “distracted” vs. “attentive” labeling requires inference about driver intent from gaze and head pose data that is itself ambiguous at edge conditions.
This problem compounds silently: a system may appear to perform adequately simply because the evaluation baseline is noisy at the conditions that matter most. Synthetic data eliminates the need for annotation entirely. Gaze vectors, head pose angles, eyelid aperture, and PERCLOS values are exact outputs of the simulation by construction. This is not a convenience feature. It is the only way to obtain reliable ground truth at the edge conditions where real-world annotation breaks down.
The Impossibility of Safe and Reproducible Failure Induction
Several failure conditions that a production DMS will encounter cannot be safely or reproducibly induced in a real-world data collection context:
Condition | Why It Cannot Be Collected |
Extreme fatigue states | Inducing genuine microsleep in a recording session is neither ethical nor safe |
NIR illuminator partial failure | Requires hardware fault injection at specific, quantified degradation levels — not reproducible across vehicles |
Lens contamination at defined severity | Contamination in real collection is uncontrolled and non-repeatable |
Multi-camera desync under thermal stress | Requires controlled thermal cycling — impossible in naturalistic recording |
These are not theoretical edge cases. They are conditions a production system will encounter over a vehicle lifetime, and a validation suite that cannot test them has a structural blind spot.
Cost and Scale Constraints
A single photometric parameter sweep across ten lighting conditions, three sensor states, and five demographic subgroups generates 150 scenario variants — each requiring sufficient footage under consistent conditions with reliable ground truth. Scaling that across the full failure mode taxonomy is neither financially nor logistically feasible.
Real-world data remains essential for domain validation and distribution calibration. It cannot be the sole basis for systematic stress-testing.

Synthetic Data as Stress-Test Infrastructure, and the Sim-to-Real Question
Synthetic data is that infrastructure, not as a supplement to real-world collection, but as the engineered foundation of a complete stress-test pipeline.
The case for synthetic data in DMS validation is not primarily about edge cases, although it handles those well. It is about control. A synthetic data pipeline gives the validation engineer something that no real-world collection campaign can offer: the ability to hold every variable constant except the one being tested:
- Vary illumination angle in 2° increments while holding head pose, demographics, and sensor state fixed
- Inject a specific NIR illuminator degradation level and measure its isolated effect on PERCLOS estimation accuracy
- Replay the exact tunnel exit lighting transition from Section 1 — the same NIR saturation at 15° sun elevation, the same 1.2-second classification window — with and without polarized sunglasses, across ten demographic variants
None of this is tractable with collected data. All of it is routine with a parametric synthetic pipeline.
The Sim-to-Real Objection
The objection a technical reader will raise at this point is legitimate: synthetic data introduces a domain gap. A model validated on synthetic imagery may perform differently on real sensor output, and a stress-test suite populated with synthetic scenarios may not accurately predict real-world failure boundaries.
This objection applies to generic rendering pipelines. It does not apply with the same force to sensor-accurate simulation. The relevant question is not whether the synthetic image looks photorealistic to a human observer — it is whether it accurately models the physical processes that determine how a real sensor responds to a given scene:
Physical Process | Simulatable Parameter |
NIR illumination physics | Spectral output, angle of incidence, reflectance by material |
Lens characteristics | Point spread function, distortion profile, vignetting |
Sensor noise | Shot noise, read noise, fixed pattern noise at defined temperature |
Illuminator degradation | Output decay curve over simulated vehicle lifetime |
When a synthetic pipeline is built on accurate sensor models rather than approximate rendering, the domain gap narrows to the residual between the sensor model and the physical sensor — a tractable engineering problem, not a fundamental objection. Sensor-accurate simulation does not eliminate the sim-to-real gap. It reduces it to a known, measurable quantity that can be managed through targeted real-world validation on a representative holdout set.
What Synthetic Infrastructure Enables
With sensor-accurate synthetic data as the stress-test foundation, the validation pipeline gains four capabilities that are structurally unavailable with real-world data alone:
Capability | What It Enables |
Parametric control | Every failure mode dimension in Section 2’s taxonomy — lighting angle, occluder type, head pose range, skin tone, sensor degradation — varied independently and in combination |
Reproducibility | Every scenario is exactly replayable, enabling regression testing across model versions and direct comparison of validation results across development cycles |
Scalability | Parameter sweeps that would require months of real-world collection are generated programmatically in hours |
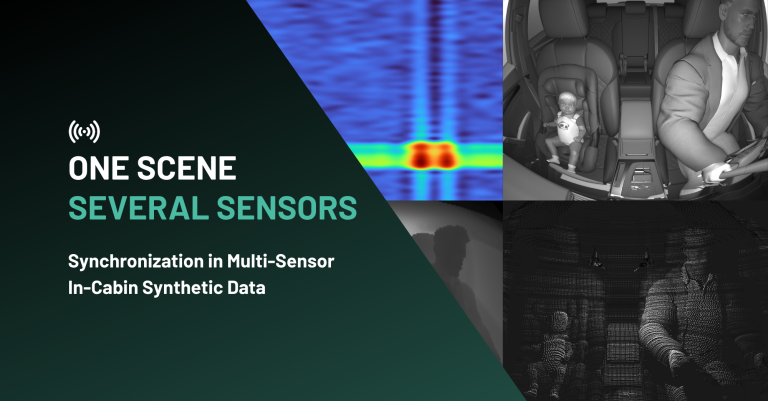
Modality coverage | NIR, RGB, and Radar sensor outputs simulated within the same scene, supporting multi-modal DMS architectures without separate collection campaigns per modality |
Coverage Guarantees: Proving the Test Suite Spans the Failure Space
The most consequential capability that synthetic stress-test infrastructure enables is not speed or scale, it is the ability to make a formal coverage claim.
With a parametric pipeline, the validation engineer can fully characterize the test suite’s operating envelope:
- Lighting conditions tested
- Head pose ranges exercised
- Demographic subgroups represented
- Sensor degradation states included
This characterization can be documented, audited, and compared against the expected production distribution — something a naturalistic dataset can never offer. A naturalistic dataset can be described statistically. A synthetic stress-test suite can be proven to cover a specified operating envelope.
For teams operating under ISO 26262 or SOTIF frameworks, where the scope of validation coverage is a documentation requirement, this is not an academic distinction. It is the difference between asserting that a system has been adequately tested and demonstrating it.

Operationalizing Stress-Testing with Anyverse INCABIN
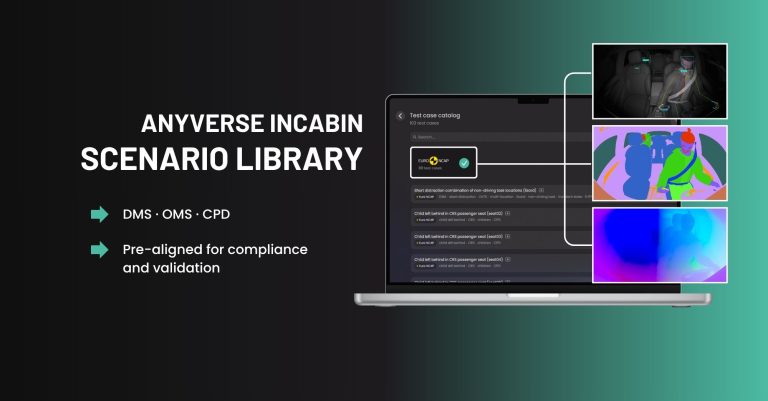
Anyverse INCABIN is built to operationalize that coverage claim as a platform architected specifically around the in-cabin monitoring validation workflow. Every metric we previously defined has a corresponding ground truth output. The stress-test methodology we have described requires a platform that can execute each step without the validation engineer building simulation infrastructure from scratch.
Sensor Simulation Across Modalities
Anyverse INCABIN simulates NIR, RGB, and Radar outputs within the same scene and from the same scenario configuration. Multi-modal DMS architectures can therefore be stress-tested without separate data collection or simulation campaigns per modality. Sensor-specific failure modes — NIR illuminator saturation, ToF range ambiguity at close distances, RGB performance under low-light conditions — can be tested in isolation or in combination within a single parametric sweep.
The same physical models described in the previous section, covering NIR illumination physics, lens characteristics, sensor noise profiles, and illuminator degradation, are implemented directly in Anyverse INCABIN.
Parametric Control Over the Full Failure Mode Space
Every failure mode category in the taxonomy previously covered maps to a set of controllable parameters in Anyverse INCABIN:
Failure Mode Category | Controllable Parameters |
Photometric | Illumination angle, intensity, spectral composition, ambient light conditions, tunnel transition profiles |
Geometric | Head pose (pitch, yaw, roll), seat position offset, camera mounting geometry |
Occlusion | Occluder type, coverage area, NIR transmittance, dynamic occlusion onset |
Demographic | Skin tone across Fitzpatrick scale, facial geometry variance, age-related morphological variation |
Temporal | Microsleep onset trajectory, rapid transition profiles, inter-frame state change rates |
Sensor-level | Illuminator output level, lens contamination severity, multi-camera timing offset |
Parameter sweeps are scripted, not manual. A validation engineer defines the parameter space and boundary conditions. Anyverse INCABIN generates scenario variants programmatically — the automated sweep capability previously identified as the practical resolution to the combinatorial explosion problem.
Ground Truth Outputs
For each generated scenario, Anyverse INCABIN produces ground truth annotations that are exact by construction:
- Gaze vectors (3D, per frame)
- Head pose angles (pitch, yaw, roll)
- Eyelid aperture and PERCLOS values
- Facial landmark positions (2D and 3D)
- Segmentation masks (face region, eye region, occluder)
- Sensor state metadata (illuminator output level, noise profile, calibration offset)
This includes the ambiguous transitional frames and boundary head pose conditions where real-world annotation is least reliable — precisely the evaluation points that matter most for both DDAW and ADDW validation.
Integration into the Validation Pipeline
Anyverse INCABIN output integrates directly into ML training and validation workflows:
- Synthetic scenario datasets complement real-world training data, targeting specific failure mode gaps identified in the stress-test suite
- Exact scenario reproducibility enables regression testing across model versions — the same parameter sweep reruns after each training iteration to track performance envelope changes
- Ground truth metadata and scenario parameter logs are structured for inclusion in functional safety documentation under ISO 26262 and SOTIF, supporting the per-subgroup disaggregated metrics requirements previously described
Anyverse INCABIN does not replace real-world validation data. It provides the controlled, annotated, combinatorially complete stress-test layer that real-world data cannot — and connects that layer directly to the training, evaluation, and documentation workflows where it has operational impact.
From GSR to Euro NCAP: Building Regulatory Headroom Through Engineering Rigor
GSR’s hard detection thresholds are the inner boundary of a system’s performance envelope, not its outer limit. GSR establishes whether a compliant DDAW and ADDW system is present. It says nothing about how that system performs across the full distribution of real-world operating conditions. That distinction between presence and performance is where the gap between regulatory compliance and genuine system robustness lives.
Euro NCAP’s Driver State Monitoring assessment protocol has been active since January 2023, forming part of the Safety Assist – Safe Driving star-rating protocol. From 2026, it expands significantly: DMS performance is incorporated into a new scored ‘Driver Engagement’ category worth up to 25 points, and the assessment scope extends to impairment detection, HMI evaluation, and adaptive safety features. The framework operates on a fundamentally different logic from GSR’s binary gate. Rather than a binary pass/fail gate, NCAP applies a scored evaluation across multiple performance dimensions. A system that meets GSR’s detection threshold under nominal conditions but degrades under photometric stress, demographic variation, or sensor aging is unlikely to score well under a graded assessment that specifically probes those dimensions.
GSR vs. Euro NCAP: What the Assessment Gap Looks Like in Practice
Dimension | GSR Mandate | Euro NCAP 2026/2029 |
Detection requirement | DDAW and ADDW system must be present and functional | Scored performance across defined test scenarios |
Lighting conditions | Not specified | Multiple conditions including adverse |
Demographic coverage | Not specified | Performance across driver subgroups |
Sensor degradation | Not specified | Performance under defined degradation states |
Temporal performance | Response time threshold | Graded sensitivity assessment |
Documentation | Compliance declaration | Performance evidence required |
Anyverse is working in a research partnership with Euro NCAP to explore how high-fidelity synthetic data can strengthen the assessment of in-cabin monitoring systems. The collaboration focuses on the specific performance dimensions that NCAP’s scored evaluation will scrutinize: adverse lighting, demographic coverage, sensor degradation, and temporal edge cases. The scenario design and validation protocols in Anyverse INCABIN are directly informed by that work, which means the stress-test coverage the platform enables is aligned with where NCAP’s assessment will actually apply pressure, not where GSR’s binary threshold stops.
The implication for development teams is clear: a validation strategy built solely around GSR compliance is optimized for the wrong target. The failure modes that GSR leaves unspecified — adverse lighting, demographic variation, sensor degradation, temporal edge cases — are precisely the dimensions that stress-testing addresses and that NCAP’s scored assessment will increasingly scrutinize.
There is also a straightforward business case. Discovering that a system underperforms on NCAP’s graded criteria during assessment is expensive — in remediation cost, in development cycle time, and in commercial exposure. Discovering the same failure modes during simulation-based stress testing before the system reaches assessment is orders of magnitude cheaper. The stress-test methodology described in this article is not only better engineering. It is better risk management.
Build for the Road, Not the Rulebook: A Stress-Testing Imperative for DMS Validation
And risk management, in the end, comes down to a single question: did you find the failure before the failure found you? On the A9, at 06:47 on a January morning, the answer was no. The NIR illuminator saturated. The classifier was confident. The driver was not alert. The system did not know the difference.
That gap, between a system that passes certification and a system that performs, is what stress-testing exists to close. The question is not whether your system passes GSR.
The question is whether you found that 1.2 seconds before the road did.
Sources
- European Commission Road Safety Observatory. Fatigue — Frequency of fatigue-related crashes. https://road-safety.transport.ec.europa.eu/european-road-safety-observatory/statistics-and-analysis-archive/fatigue/frequency-fatigue-related-crashes_en
- European Commission Road Safety Observatory. Fatigue — overview page.https://road-safety.transport.ec.europa.eu/european-road-safety-observatory/statistics-and-analysis-archive/fatigue/fatigue_en
- EUR-Lex. EU Regulation 2019/2144 — General Safety Regulation. https://eur-lex.europa.eu/legal-content/EN/TXT/?uri=CELEX:32019R2144
- EUR-Lex. Delegated Regulation (EU) 2023/2590 — ADDW technical requirements. https://eur-lex.europa.eu/legal-content/EN/TXT/?uri=CELEX:32023R2590
- InterRegs. EU Regulation on Advanced Driver Distraction Warning Systems Published. https://www.interregs.com/articles/spotlight/260/eu-regulation-on-advanced-driver-distraction-warning-systems-published-
- Seeing Machines. Understanding Advanced Driver Distraction Warning (ADDW) Systems. https://seeingmachines.com/understanding-advanced-driver-distraction-warning-addw-systems/
- Anyverse. In-Cabin Monitoring: Navigating Europe’s Safe Driving New Standards. https://medium.com/anyverse/in-cabin-monitoring-navigating-europes-safe-driving-new-standards-e0866e73fdde
- Setchfield et al. (2026). Optical limits in skin reflectance measurement. Journal of Investigative Dermatology / ScienceDirect. Peer-reviewed. https://www.sciencedirect.com/science/article/pii/S0022202X26010146
- News-Medical.net (2024). Exploring the role of melanin in near-infrared spectroscopy measurement outcomes. https://www.news-medical.net/news/20241003/Exploring-the-role-of-melanin-in-near-infrared-spectroscopy-measurement-outcomes.aspx
- Sensors / MDPI (2018). Performance Evaluation Strategies for Eye Gaze Estimation Systems. https://www.mdpi.com/1424-8220/18/9/3151
- ScienceDirect (2024). An efficient multi-task learning CNN for driver attention monitoring. https://www.sciencedirect.com/science/article/pii/S1383762124000225
- PMC / Sleep Research Society (2023). PERCLOS-based technologies for detecting drowsiness: current evidence and future directions. https://pmc.ncbi.nlm.nih.gov/articles/PMC10108649/
- Journal of Vision / ARVO (2012). PERCLOS Threshold for Drowsiness Detection during Real Driving. https://jov.arvojournals.org/article.aspx?articleid=2141193
- ISO. ISO 21448:2022 — Road vehicles: Safety of the Intended Functionality. Official standard. https://www.iso.org/standard/70939.html
- PatSnap (2026). ISO 26262 vs ISO 21448 SOTIF for autonomous driving. https://www.patsnap.com/resources/blog/articles/iso-26262-vs-iso-21448-sotif-for-autonomous-driving/
- arxiv.org (2023). On Quantification for SOTIF Validation of Automated Driving Systems. https://arxiv.org/pdf/2304.10170
- Euro NCAP (2025). Euro NCAP announces 2026 protocol changes to tackle modern driving risks. https://www.euroncap.com/press-media/euro-ncap-announces-2026-protocol-changes-to-tackle-modern-driving-risks/
- AVL (2025). Euro NCAP 2026: What’s Changing and How to Stay Compliant. https://www.avl.com/en/blog/euro-ncap-2026-whats-changing-and-how-stay-compliant
- AB Dynamics (2026). Euro NCAP 2026 Assisted Driving Integration. https://www.abdynamics.com/category/euro-ncap/
- Anyverse (2025). Anyverse & Euro NCAP Explore Synthetic Data for In-Cabin Assessment. https://anyverse.ai/anyverse-euro-ncap-synthetic-data-in-cabin-monitoring-assessment/
- Anyverse & Sony (2025). Anyverse & Sony Advance In-Cabin Safety with Synthetic Data. https://anyverse.ai/anyverse-sony-in-cabin-monitoring-collaboration/
- Anyverse & GMV (2025). GMV and Anyverse Partner to Advance In-Cabin AI and Safety Systems. https://www.autonomousvehicleinternational.com/news/simulation/gmv-adds-anyverses-synthetic-data-expertise-to-its-in-cabin-monitoring.html